Visualisation Diagram
A visualisation diagram (sometimes called a hand drawn design in school) is a drawing showing what something will look like when it is created. They are used to help plan graphical images such as book, game, dvd covers and posters, or "still", non moving sections of other products for example a screen in a game or an animation. In industry they can be a rough sketch or a detailed final design, on the iMedia projects they should be detailed. They can be created by hand or digitally - on the projects I will ask you to do them by hand to make it clear what they are.
The purpose of the visualisation digram is to show (in a visual way) what the finished product might look like, what elements it may contain and how it will be laid out. It's main audience is the designer.
A visualisation diagram should contain both the content and the position of the different elements, for example:
- Images
- Backgrounds
- Borders
- Text - font type, size and colour
- Navigation elements (if appropriate)
When creating your visualisation diagrams use annotations to explain what the different elements are and why you have chosen them - the second part is not usually needed in industry but is worth doing on the projects. The quality of annotation often comes up in exam questions on visualisation diagrams. If you are asked to draw one in the exam then there will be marks for the annotations.
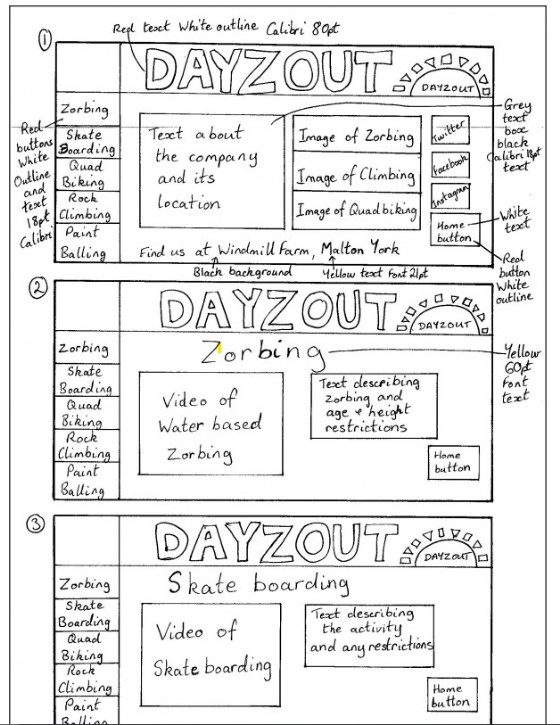
Image Credit : OCR Exam Board